
In the modern corporate finance environment, data is abundant, but actionable intelligence remains frustratingly scarce. Chief Financial Officers (CFOs) and financial controllers invest millions of dollars into enterprise resource planning (ERP) systems like SAP, Oracle, or Microsoft Dynamics. Yet, when it comes time for month-end close or board-level strategic planning, the reality is stark: highly paid financial analysts are still manually exporting CSV files and copying data into static spreadsheets.
This manual bridging between heavy corporate databases and agile analytics tools is the most significant bottleneck in modern financial reporting. Today, mastering financial data automation is no longer a niche IT skill; it is a core competency required for competitive corporate strategy.
The ERP Limitation: Why Raw Exports Are Not Enough
Enterprise Resource Planning software is exceptionally good at logging transactions, ensuring compliance, and maintaining a rigid general ledger. However, ERPs are notoriously rigid when it comes to custom data visualization, ad-hoc variance analysis, or dynamic forecasting.
When finance teams rely on manual data extraction to bridge this gap, they introduce massive operational risks:
- Version Control Chaos: Multiple analysts downloading the same ERP report on different days leads to conflicting «versions of the truth.»
- Time Sinks: Finance teams spend 80% of their time prepping data and only 20% actually analyzing it.
- Human Error in Multi-Year Projections: Manually dragging formulas across complex spreadsheets drastically increases the risk of critical miscalculations, especially when modeling long-term constraints or asynchronous accounting adjustments.
To eliminate these risks, businesses must implement a robust middleware layer that automates the extraction, transformation, and loading (ETL) of financial data.
Power Query: The Ultimate ETL Tool for Finance Professionals
For organizations heavily invested in the Microsoft ecosystem, the solution to this data fragmentation is already built into their existing software stack: Power Query.
Rather than relying on IT departments to build custom SQL queries for every minor reporting change, financial controllers can use Power Query to establish direct, automated pipelines between their ERP databases and their analytical models.
Building Automated Reporting Dashboards
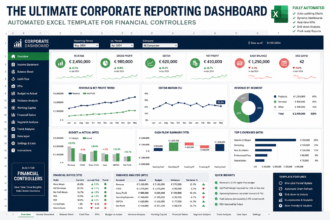
The ultimate goal of financial data automation is to feed clean, real-time data into automated reporting dashboards.
When the underlying data is continuously piped in via Power Query or an API, finance teams can transition from historical reporting to predictive analytics. A well-architected dashboard allows executives to dynamically filter data by region, product line, or fiscal quarter without ever touching a spreadsheet cell.
This level of integration is driving massive investments in Business Intelligence (BI) platforms. Whether deploying Microsoft Power BI to visualize Power Query data, or integrating third-party SaaS analytics tools, the foundation remains the same: the automated, error-free flow of data.
The ROI of Financial Automation
Investing time and resources into ERP Excel integration and data automation yields an immediate and quantifiable return on investment. By eliminating manual data entry, companies drastically reduce the cycle time for their month-end close.
More importantly, it elevates the role of the financial analyst. By removing the burden of manual data processing, analysts can dedicate their expertise to what truly matters: uncovering cost-saving opportunities, optimizing capital allocation, and driving strategic growth.
At FinanceStackHQ, we believe that the future of corporate finance belongs to those who automate the routine and analyze the exceptional. Building automated pipelines is the first critical step toward that future.